












Home
Resources
Motors
How to Optimize Your Used Car Inventory Turn Rate

The Hidden Cost of Lot Depreciation: How to Optimize Your Used Car Turn Rate

Download the local growth playbook
This simple, mobile-first playbook shows you how to source inventory, price competitively, and start selling in minutes. No upfront costs or complex systems required.
Thank you! Your submission has been received!
Oops! Something went wrong while submitting the form.
Motors
4

Every day a vehicle sits, it quietly spends your margin. Used car inventory turn rate tells you how efficiently your dealership converts stocked vehicles back into cash, but the number is more than a sales KPI. It captures pricing discipline, reconditioning speed, merchandising quality, buyer demand, and sourcing decisions. Improve the turn, and you can reduce market-value exposure, free working capital, and keep more of the gross you planned for when you bought the car.

Lot depreciation is bigger than a price drop

Lot depreciation is the total economic loss that builds while a unit ages. Wholesale and retail values may move against you, but that’s only the first layer. Floorplan interest or the opportunity cost of cash continues. Insurance, storage, washing, battery care, repeated photography, and paid promotion add up. A stale vehicle can also crowd out a faster seller you could have bought instead.

Then comes the painful part: the late markdown. A vehicle priced to yesterday’s market may generate weak engagement today. By the time the price catches up, you’ve already paid carrying costs and lost valuable selling days. In January 2024, NIADA reported that nine car segments fell an average of $55 in one week, while vehicles were taking 56 days to turn. That snapshot shows why time and market movement have to be managed together.
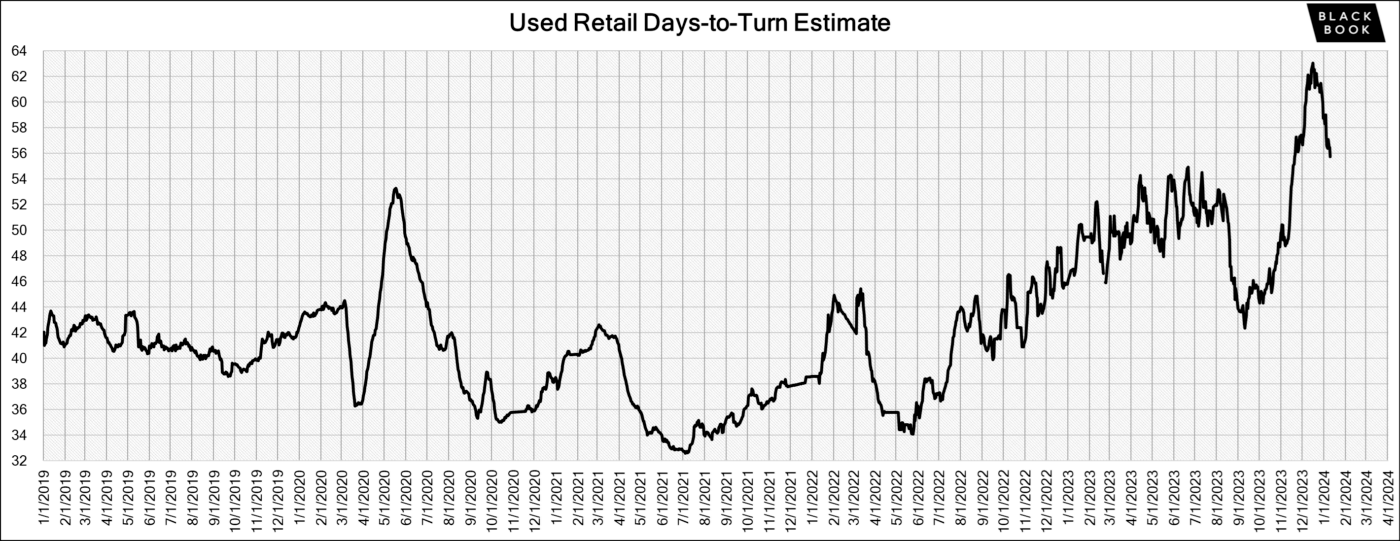
NIADA used retail days-to-turn estimate graph

1. Put a daily dollar value on age

We recommend estimating holding cost at the unit level:

Daily holding cost = financing cost + expected market depreciation + upkeep + advertising + allocated overhead

Here’s an illustrative example, not an industry rule. A $25,000 unit financed at 8.5% costs about $5.82 per day in interest alone. Over 60 days, that’s roughly $349. Add a $400 market adjustment, $150 in upkeep, and $75 in extra promotion, and the aging burden reaches $974 before any surprise repair or wholesale exit loss.

This calculation changes the conversation. A $600 price move on day 30 may protect more gross than a $1,200 reduction on day 60. The goal isn’t to discount everything quickly. It’s to act while you still have choices.

Holding cost calculator
60
Costs over that window

Holding cost at 60 days

$974
accruing at $16.24 a day

Not included: reconditioning surprises and wholesale exit loss, which land hardest on the oldest units.

The timing question

Compare acting on day

versus day

$487

Show the math

    An example, not an industry rule. Replace every figure with your own store's numbers — floorplan terms, reconditioning history, and depreciation curves vary by market and segment.

    2. Calculate used car inventory turn rate

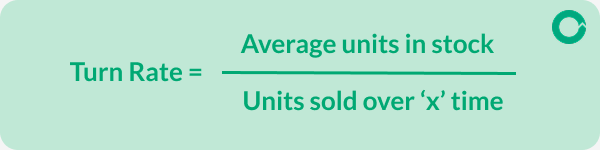
    For operational reporting, we recommend calculating inventory turn with vehicle counts. This method, outlined below, shows you how to calculate your used car inventory turn rate. Basically, how many times your dealership sold through its average retail inventory during a specific period:

    Turn rate = average units in stock / units sold during ‘x’ time period
    First, calculate average inventory:

    Average inventory = (beginning inventory + ending inventory) / 2
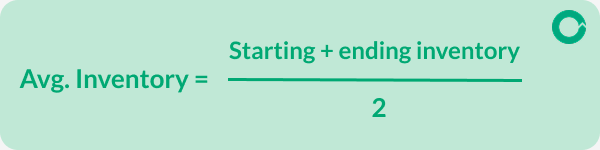
    Suppose you began the quarter with 40 used vehicles and ended with 50. Your average inventory was 45 units. If inventory levels changed significantly during the quarter, use a daily average instead: add each day’s ending inventory and divide by the number of days.

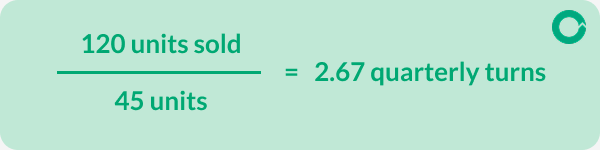
    Next, divide the number of retail units sold during the 90-day quarter by 45:

    120 retail units sold / 45 units (average inventory) = 2.67 quarterly turns
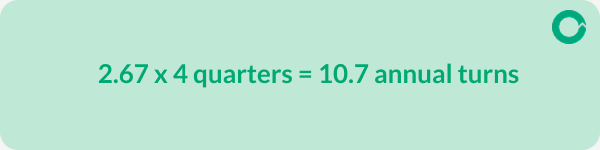
    To compare that result with annual benchmarks, annualize it:

    2.67 × 4 quarters = approximately 10.7 annual turns
    You can then estimate days to turn:

    365 / 10.7 = approximately 34 days
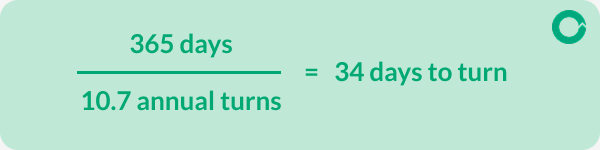
    That means your current sales pace would cycle through the average inventory roughly every 34 days.

    Finance and accounting teams may instead divide the cost of goods sold by average inventory at cost. Either approach can be useful, but use one consistently and label it clearly. Don’t mix units and dollars in the same ratio. We also recommend excluding wholesale disposals from retail sales so auction cleanups don’t overstate retail performance.

    Used inventory turn calculator
    Optional

    Depreciation, floorplan interest, insurance, reconditioning risk. Use your own figure if you track it.

    Days to turn

    days

    ≤30 fast456090+ aging

    Average inventory
    Turns this period
    Annualized turns
    Sales pace, annualized

    Show the math

      Estimates for planning only. Turn rate conventions vary — align with your DMS reporting before setting targets.

      Used car inventory turn rate benchmarks dealership teams can use

      There isn’t one honest benchmark for every store. NIADA reported an 82-day supply for independent dealers in June 2024, then described the broader used market at slightly above 40 days’ supply in July 2025. A 56-day retail turn appeared in NIADA’s January 2024 market update. Those figures cover different populations and market conditions, so treating any one of them as the used car inventory turn rate industry average would create false precision.

      Convert days into a comparable annual pace: 40 days equals about 9.1 turns, 45 days equals 8.1, 56 days equals 6.5, 60 days equals 6.1, and 82 days equals 4.5. Use those as context, then set targets by price band, age, body style, acquisition source, and local demand. Your best benchmark is your own trailing trend against a clearly defined buyer profile.

      NIADA has reported several benchmarks under different market conditions:

      Because these figures reflect different dealer populations and market conditions, treating any one of them as the definitive used car inventory turn rate industry average would create false precision. There is no single, most reliable benchmark for every dealership.

      Convert days in inventory to annual turns

      Average days in inventory to Approximate annual turns:

      • 30 days = 12.2 turns
      • 40 days = 9.1 turns
      • 50 days = 7.3 turns
      • 60 days = 6.1 turns
      • 75 days = 4.9 turns
      • 90 days = 4.1 turns

      How to set a useful benchmark

      Use industry figures for context, then establish targets based on factors that affect your specific inventory:

      • Price band
      • Vehicle age
      • Body style
      • Acquisition source
      • Local buyer demand

      Ultimately, your most useful benchmark is your dealership’s own trailing performance. Track it consistently and compare results against a clearly defined buyer profile rather than relying on a single national average.

      3. Segment the number before you manage it

      A storewide average can hide both winners and problems. Break inventory into 0-15, 16-30, 31-45, 46-60, and 61-plus day buckets. Then review each cohort by:

      • Days from acquisition to frontline readiness
      • Price-to-market position and recent market movement
      • Listing views, saves, messages, calls, appointments, and test drives
      • Lead response time and appointment close rate
      • Front-end gross after estimated holding cost
      • Retail outcome versus wholesale exit

      A strong total turn can still mask a slow luxury SUV cohort or a reconditioning bottleneck. The smaller cuts tell you where to act.

      4. Build a faster path from acquisition to sale

      • Buy to a written exit plan. Before bidding, define the target buyer, expected retail range, reconditioning ceiling, target frontline date, first review date, and wholesale exit point. Hope isn’t an inventory strategy.
      • Start the clock at acquisition. Don’t wait until the vehicle reaches the front line. NIADA reported average independent-dealer reconditioning costs of $1,679 in 2024, more than $500 above 2020. Track approval delays, parts waits, vendor time, and photo readiness so you can remove the friction you control.
      • Price to today’s alternatives. Review competitive listings and recent value movement at least weekly, more often in volatile segments. Price bands matter: a small change that crosses a shopper’s search ceiling can expand the audience without a dramatic markdown.
      • Merchandise for questions, not just clicks. Lead with clear photos, trim, mileage, condition, vehicle history context, payment-relevant details, and a direct next step. If engagement is low, fix the listing before assuming the vehicle itself is wrong.

      5. Use demand signals before the age policy fires

      Age rules are useful guardrails, but buyer behavior gives you an earlier warning. Zero messages after strong view volume may point to price or trust. Low views may signal weak distribution, an uncompetitive thumbnail, or a mismatch with local demand. Messages without appointments may expose slow follow-up or missing information.

      With OfferUp Motors, we help dealerships put inventory in front of local shoppers through a Verified Dealer Profile, automatic DMS inventory sync, promotions, click-to-call, lead filtering, and a performance dashboard. Use those signals to decide whether to refresh creative, promote a unit, adjust price, or move it through another channel. The point is simple: don’t wait for age alone to tell you what engagement already knows.

      6. Create an aging cadence your team can run

      Assign a specific decision to each checkpoint:

      • Day 0-3: Complete inspection, recon approval, pricing, photos, and syndication.
      • Day 7: Check listing accuracy, response time, and early shopper signals.
      • Day 15: Compare engagement and price-to-market position by cohort.
      • Day 30: Reprice, re-merchandise, promote, or transfer based on evidence.
      • Day 45: Require a manager decision with a documented gross-at-risk estimate.
      • Day 60+: Retail only with a clear reason; otherwise exit and redeploy the cash.

      Meet weekly with sales, used-car management, recon, and marketing. Review exceptions, assign owners, and record the next action. A policy without ownership is just a calendar reminder.

      7. Protect gross by managing speed and mix

      Faster isn’t automatically better. Underpricing can produce a great turn and a weak return. Overbuying only the quickest sellers can also leave important buyer needs uncovered. Pair turn with gross per unit, total departmental gross, return on inventory investment, stock-out frequency, and aged-unit loss.

      The same discipline applies to sourcing. NADA’s 2025 profile shows franchised dealers sourced retailed used vehicles from new-vehicle trade-ins, auctions, used-vehicle trade-ins, street purchases, and other channels. Measure turn and net contribution by source. If one channel regularly creates long recon cycles or weak local fit, adjust the buy rules instead of blaming the sales team later.

      Turn rate is a margin protection system

      The best inventory turnover isn’t the highest number on a dashboard. It’s the pace that keeps desirable vehicles available, limits avoidable holding loss, and produces healthy net gross. Start with clean math. Add daily holding cost, cohort-level demand signals, and firm aging decisions. Then use local reach and listing performance to intervene early.

      When every unit has an owner, a deadline, and an exit plan, depreciation stops being a surprise. You may not control the market, but you can control how long you remain exposed to it.

      Heading 1

      Heading 2

      Heading 3

      Heading 4

      Heading 5
      Heading 6

      Lorem ipsum dolor sit amet, consectetur adipiscing elit, sed do eiusmod tempor incididunt ut labore et dolore magna aliqua. Ut enim ad minim veniam, quis nostrud exercitation ullamco laboris nisi ut aliquip ex ea commodo consequat. Duis aute irure dolor in reprehenderit in voluptate velit esse cillum dolore eu fugiat nulla pariatur.

      Block quote

      Ordered list

      1. Item 1
      2. Item 2
      3. Item 3

      Unordered list

      • Item A
      • Item B
      • Item C

      Text link

      Bold text

      Emphasis

      Superscript

      Subscript

      The Hidden Cost of Lot Depreciation: How to Optimize Your Used Car Turn Rate

      image of a community event hosted by an insurance agency & company
      August 31, 2026

      Every day a vehicle sits, it quietly spends your margin. Used car inventory turn rate tells you how efficiently your dealership converts stocked vehicles back into cash, but the number is more than a sales KPI. It captures pricing discipline, reconditioning speed, merchandising quality, buyer demand, and sourcing decisions. Improve the turn, and you can reduce market-value exposure, free working capital, and keep more of the gross you planned for when you bought the car.

      Lot depreciation is bigger than a price drop

      Lot depreciation is the total economic loss that builds while a unit ages. Wholesale and retail values may move against you, but that’s only the first layer. Floorplan interest or the opportunity cost of cash continues. Insurance, storage, washing, battery care, repeated photography, and paid promotion add up. A stale vehicle can also crowd out a faster seller you could have bought instead.

      Then comes the painful part: the late markdown. A vehicle priced to yesterday’s market may generate weak engagement today. By the time the price catches up, you’ve already paid carrying costs and lost valuable selling days. In January 2024, NIADA reported that nine car segments fell an average of $55 in one week, while vehicles were taking 56 days to turn. That snapshot shows why time and market movement have to be managed together.

      NIADA used retail days-to-turn estimate graph

      1. Put a daily dollar value on age

      We recommend estimating holding cost at the unit level:

      Daily holding cost = financing cost + expected market depreciation + upkeep + advertising + allocated overhead

      Here’s an illustrative example, not an industry rule. A $25,000 unit financed at 8.5% costs about $5.82 per day in interest alone. Over 60 days, that’s roughly $349. Add a $400 market adjustment, $150 in upkeep, and $75 in extra promotion, and the aging burden reaches $974 before any surprise repair or wholesale exit loss.

      This calculation changes the conversation. A $600 price move on day 30 may protect more gross than a $1,200 reduction on day 60. The goal isn’t to discount everything quickly. It’s to act while you still have choices.

      Holding cost calculator
      60
      Costs over that window

      Holding cost at 60 days

      $974
      accruing at $16.24 a day

      Not included: reconditioning surprises and wholesale exit loss, which land hardest on the oldest units.

      The timing question

      Compare acting on day

      versus day

      $487

      Show the math

        An example, not an industry rule. Replace every figure with your own store's numbers — floorplan terms, reconditioning history, and depreciation curves vary by market and segment.

        2. Calculate used car inventory turn rate

        For operational reporting, we recommend calculating inventory turn with vehicle counts. This method, outlined below, shows you how to calculate your used car inventory turn rate. Basically, how many times your dealership sold through its average retail inventory during a specific period:

        Turn rate = average units in stock / units sold during ‘x’ time period

        First, calculate average inventory:

        Average inventory = (beginning inventory + ending inventory) / 2

        Suppose you began the quarter with 40 used vehicles and ended with 50. Your average inventory was 45 units. If inventory levels changed significantly during the quarter, use a daily average instead: add each day’s ending inventory and divide by the number of days.

        Next, divide the number of retail units sold during the 90-day quarter by 45:

        120 retail units sold / 45 units (average inventory) = 2.67 quarterly turns

        To compare that result with annual benchmarks, annualize it:

        2.67 × 4 quarters = approximately 10.7 annual turns

        You can then estimate days to turn:

        365 / 10.7 = approximately 34 days

        That means your current sales pace would cycle through the average inventory roughly every 34 days.

        Finance and accounting teams may instead divide the cost of goods sold by average inventory at cost. Either approach can be useful, but use one consistently and label it clearly. Don’t mix units and dollars in the same ratio. We also recommend excluding wholesale disposals from retail sales so auction cleanups don’t overstate retail performance.

        Used inventory turn calculator
        Optional

        Depreciation, floorplan interest, insurance, reconditioning risk. Use your own figure if you track it.

        Days to turn

        days

        ≤30 fast456090+ aging

        Average inventory
        Turns this period
        Annualized turns
        Sales pace, annualized

        Show the math

          Estimates for planning only. Turn rate conventions vary — align with your DMS reporting before setting targets.

          Used car inventory turn rate benchmarks dealership teams can use

          There isn’t one honest benchmark for every store. NIADA reported an 82-day supply for independent dealers in June 2024, then described the broader used market at slightly above 40 days’ supply in July 2025. A 56-day retail turn appeared in NIADA’s January 2024 market update. Those figures cover different populations and market conditions, so treating any one of them as the used car inventory turn rate industry average would create false precision.

          Convert days into a comparable annual pace: 40 days equals about 9.1 turns, 45 days equals 8.1, 56 days equals 6.5, 60 days equals 6.1, and 82 days equals 4.5. Use those as context, then set targets by price band, age, body style, acquisition source, and local demand. Your best benchmark is your own trailing trend against a clearly defined buyer profile.

          NIADA has reported several benchmarks under different market conditions:

          Because these figures reflect different dealer populations and market conditions, treating any one of them as the definitive used car inventory turn rate industry average would create false precision. There is no single, most reliable benchmark for every dealership.

          Convert days in inventory to annual turns

          Average days in inventory to Approximate annual turns:

          • 30 days = 12.2 turns
          • 40 days = 9.1 turns
          • 50 days = 7.3 turns
          • 60 days = 6.1 turns
          • 75 days = 4.9 turns
          • 90 days = 4.1 turns

          How to set a useful benchmark

          Use industry figures for context, then establish targets based on factors that affect your specific inventory:

          • Price band
          • Vehicle age
          • Body style
          • Acquisition source
          • Local buyer demand

          Ultimately, your most useful benchmark is your dealership’s own trailing performance. Track it consistently and compare results against a clearly defined buyer profile rather than relying on a single national average.

          3. Segment the number before you manage it

          A storewide average can hide both winners and problems. Break inventory into 0-15, 16-30, 31-45, 46-60, and 61-plus day buckets. Then review each cohort by:

          • Days from acquisition to frontline readiness
          • Price-to-market position and recent market movement
          • Listing views, saves, messages, calls, appointments, and test drives
          • Lead response time and appointment close rate
          • Front-end gross after estimated holding cost
          • Retail outcome versus wholesale exit

          A strong total turn can still mask a slow luxury SUV cohort or a reconditioning bottleneck. The smaller cuts tell you where to act.

          4. Build a faster path from acquisition to sale

          • Buy to a written exit plan. Before bidding, define the target buyer, expected retail range, reconditioning ceiling, target frontline date, first review date, and wholesale exit point. Hope isn’t an inventory strategy.
          • Start the clock at acquisition. Don’t wait until the vehicle reaches the front line. NIADA reported average independent-dealer reconditioning costs of $1,679 in 2024, more than $500 above 2020. Track approval delays, parts waits, vendor time, and photo readiness so you can remove the friction you control.
          • Price to today’s alternatives. Review competitive listings and recent value movement at least weekly, more often in volatile segments. Price bands matter: a small change that crosses a shopper’s search ceiling can expand the audience without a dramatic markdown.
          • Merchandise for questions, not just clicks. Lead with clear photos, trim, mileage, condition, vehicle history context, payment-relevant details, and a direct next step. If engagement is low, fix the listing before assuming the vehicle itself is wrong.

          5. Use demand signals before the age policy fires

          Age rules are useful guardrails, but buyer behavior gives you an earlier warning. Zero messages after strong view volume may point to price or trust. Low views may signal weak distribution, an uncompetitive thumbnail, or a mismatch with local demand. Messages without appointments may expose slow follow-up or missing information.

          With OfferUp Motors, we help dealerships put inventory in front of local shoppers through a Verified Dealer Profile, automatic DMS inventory sync, promotions, click-to-call, lead filtering, and a performance dashboard. Use those signals to decide whether to refresh creative, promote a unit, adjust price, or move it through another channel. The point is simple: don’t wait for age alone to tell you what engagement already knows.

          6. Create an aging cadence your team can run

          Assign a specific decision to each checkpoint:

          • Day 0-3: Complete inspection, recon approval, pricing, photos, and syndication.
          • Day 7: Check listing accuracy, response time, and early shopper signals.
          • Day 15: Compare engagement and price-to-market position by cohort.
          • Day 30: Reprice, re-merchandise, promote, or transfer based on evidence.
          • Day 45: Require a manager decision with a documented gross-at-risk estimate.
          • Day 60+: Retail only with a clear reason; otherwise exit and redeploy the cash.

          Meet weekly with sales, used-car management, recon, and marketing. Review exceptions, assign owners, and record the next action. A policy without ownership is just a calendar reminder.

          7. Protect gross by managing speed and mix

          Faster isn’t automatically better. Underpricing can produce a great turn and a weak return. Overbuying only the quickest sellers can also leave important buyer needs uncovered. Pair turn with gross per unit, total departmental gross, return on inventory investment, stock-out frequency, and aged-unit loss.

          The same discipline applies to sourcing. NADA’s 2025 profile shows franchised dealers sourced retailed used vehicles from new-vehicle trade-ins, auctions, used-vehicle trade-ins, street purchases, and other channels. Measure turn and net contribution by source. If one channel regularly creates long recon cycles or weak local fit, adjust the buy rules instead of blaming the sales team later.

          Turn rate is a margin protection system

          The best inventory turnover isn’t the highest number on a dashboard. It’s the pace that keeps desirable vehicles available, limits avoidable holding loss, and produces healthy net gross. Start with clean math. Add daily holding cost, cohort-level demand signals, and firm aging decisions. Then use local reach and listing performance to intervene early.

          When every unit has an owner, a deadline, and an exit plan, depreciation stops being a surprise. You may not control the market, but you can control how long you remain exposed to it.